Bathtub Curve
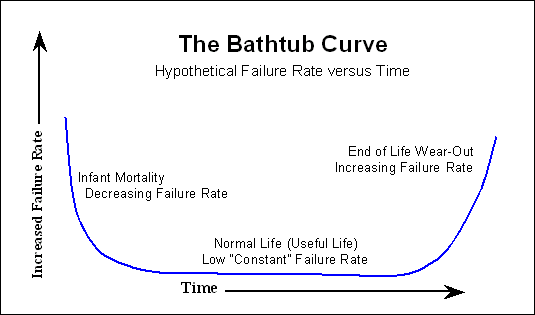
A bathtub curve is a visual representation of the failure rate of a product or group of products over time. By plotting the occurrences of failure over time, a bathtub curve maps out three periods that an asset experiences within its lifetime:
- Infant mortality period
- Normal life period
- Wear-out period
What Does a Bathtub Curve Look Like?
As its name suggests, a typical bathtub curve would resemble the diagram below.

It is important to note the trend of failure rates over time rather than the exact shape of the curve, as real-world examples might not be as clean-cut as the model.
What Is the Infant Mortality Period?
The infant mortality period, also known as the early failure period, begins when a product is used for the first time. It is an interval characterized by a decreasing failure rate, and it starts from a high failure occurrence, quickly decreasing to a lower failure rate, and plateauing.
Failures that occur within this time are usually driven by manufacturing defects or installation issues. Other causes of failure events in this period could be design flaws or improper start-up procedures.
What Is the Normal Life Period?
Once the failure rate levels out after the initial operation period, the normal life kicks in. This region of the curve is also known as the useful life period, and operators expect assets in it to have a relatively constant failure rate. The majority of assets will spend most of their operational life in this state.
Assuming a constant failure rate also implies that breakdowns are due to random events. With increased usage, and as the assets undergo normal wear, failure events become less random and more predictable. This marks the beginning of the next period in the bathtub curve.
What Is the Wear-Out Period?
Assets naturally deteriorate over time. The number of failure occurrences that an asset experiences predictably increases after a certain usage period. The wear-out region in the bathtub curve is characterized by this increasing failure rate trend. As failure rates increase quickly before the end of an asset life cycle, the bathtub curve slopes sharply upward. Eventually, this leads to the total failure of an asset.
How to Use the Bathtub Curve
The bathtub curve sets expectations for how an asset typically performs over its life cycle. Each period along the curve suggests specific strategies to teams working to extend an asset’s useful life.
For example, while failure events in the normal period are primarily due to random events, breakdowns close to the wear-out period become more predictable. Based on the age and performance of an asset, certain predictive maintenance techniques can catch failures before they occur. This is especially beneficial to teams when assets fall in the regions of the curve with higher failure rates.
Want to keep reading?
Types of Failure Consequences in Maintenance
What are the Most Common CMMS Failure Codes?
How Do I Use Failure Codes and Defect Codes in a CMMS?
4,000+ COMPANIES RELY ON ASSET OPERATIONS MANAGEMENT
Leading the Way to a Better Future for Maintenance and Reliability
Your asset and equipment data doesn't belong in a silo. UpKeep makes it simple to see where everything stands, all in one place. That means less guesswork and more time to focus on what matters.


![[Review Badge] GetApp CMMS 2022 (Dark)](https://www.datocms-assets.com/38028/1673900459-get-app-logo-dark.png?auto=compress&fm=webp&w=347)
![[Review Badge] Gartner Peer Insights (Dark)](https://www.datocms-assets.com/38028/1673900494-gartner-logo-dark.png?auto=compress&fm=webp&w=336)
