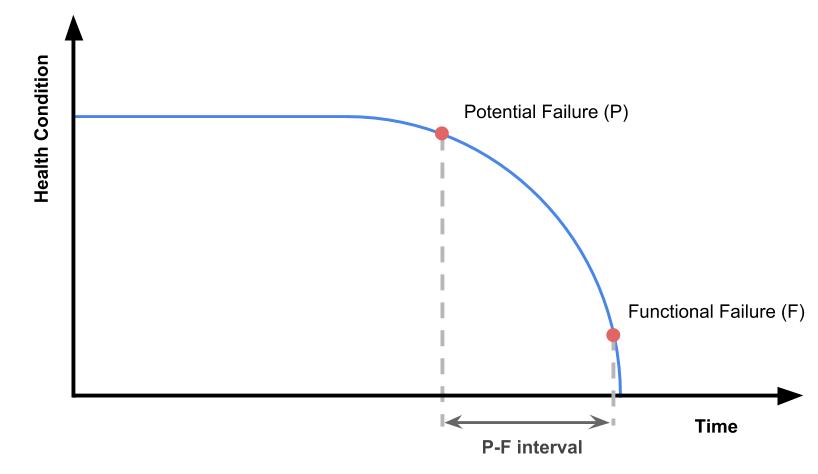
A P-F curve is a graph that shows the health of equipment over time to identify the interval between potential failure and functional failure.
Overview
The eventual failure of any equipment is inevitable. Wear and tear naturally occur with continual usage. In the same way your pair of shoes eventually get worn out after 500 miles of walking, your key plant equipment (e.g. pumps, motor bearings) will ultimately reach its functional failure point.
The good news is that the functional failure point (i.e. the end of equipment life) takes a long time to occur. The P-F curve helps to characterize the behavior of equipment over time. Its used to assess the maximum usage that can be gained from the equipment.
Potential failure and functional failure
There are two main points of the P-F curve that need to be identified.
- Potential failure indicates the point at which we notice that equipment is starting to deteriorate and fail.
- Functional failure is the point at which equipment has reached its useful limit and is no longer operational.
These two points define what’s called as the P-F interval—the time between when the failure is initially noticed and when the equipment fails completely.
How to create a P-F curve
The basic parts of the P-F curve are given above. Actual data can be expected to vary on a case to case basis. For instance, the lifespan of a heavy duty pump might not be the same as that of a mechanical bandsaw. It then follows that expected failure points for different equipment will vary. Care must be considered when building P-F curves. Different types of equipment are expected to have varying interval values.
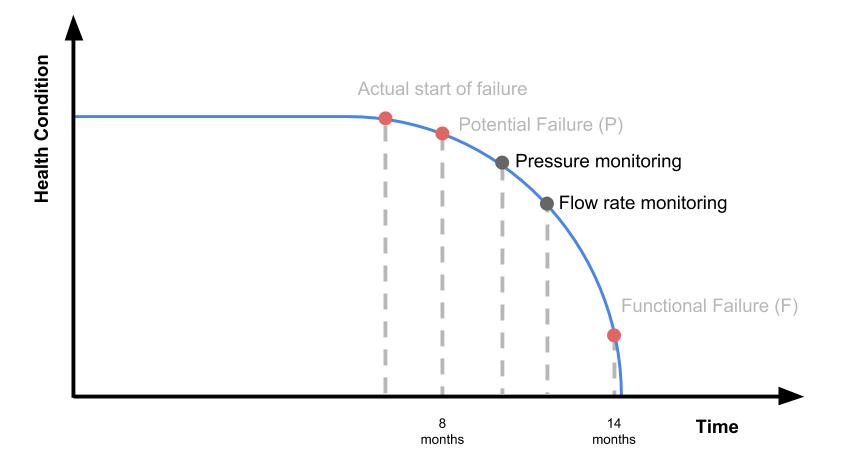
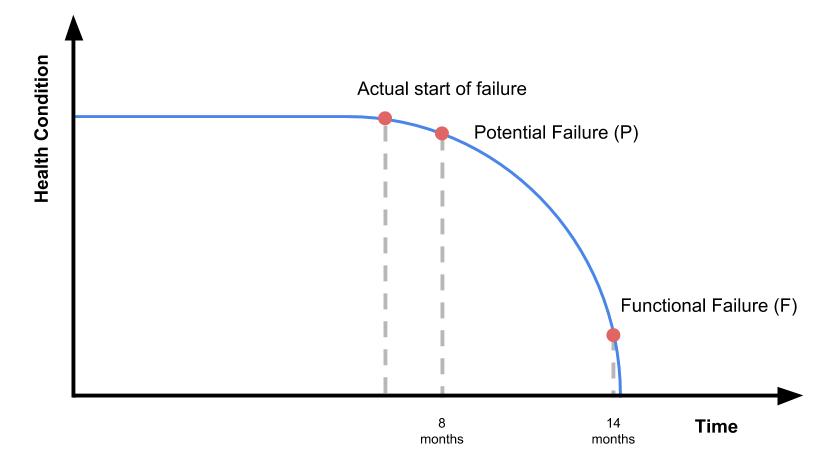
For example, assume that a pump that’s been normally operating for eight months suddenly produces more noise than usual. Unnecessary noise can be a sign of failure. With the inspection and confirmation of maintenance personnel, we can then say that the first noticed sign of failure (i.e. the potential failure point) occurred at eight months.
Note that the actual start of deterioration might have happened before the eight-month mark. So we can assume that the actual start of failure happened some time before point P. However, it is only the potential point of failure that we can measure in time with certainty as it was the first event when noticeable symptoms of failure were recorded.
For the same example, we can suppose that the pump continues to operate for another six months until it totally breaks down—that is the functional failure point at 14 months.
How to maximize the curve
Now that we’ve visualized how the P-F curve relates to real-life scenarios, we have the chance to prepare for the inevitable functional failure. The idea is to balance our resources to prolong the P-F interval economically.
Common practice is to maximize the use of the P-F curve with condition-based maintenance (CBM). By applying CBM and proactively checking the condition of the equipment, we are able to infer the rate of deterioration over time. Maintenance personnel are then able to plan and assess whether it is cost-efficient to mitigate the causes of failure given the projected P-F interval.
The P-F curve and CBM
At the early signs of failure, it may be helpful to perform routine CBM tasks to assess the health of the equipment.
Continuing with our pump example, a P-F curve coupled with CBM tasks to monitor pressure and flow rate conditions may resemble the following graph: